Карта инициативной среды ТГУ
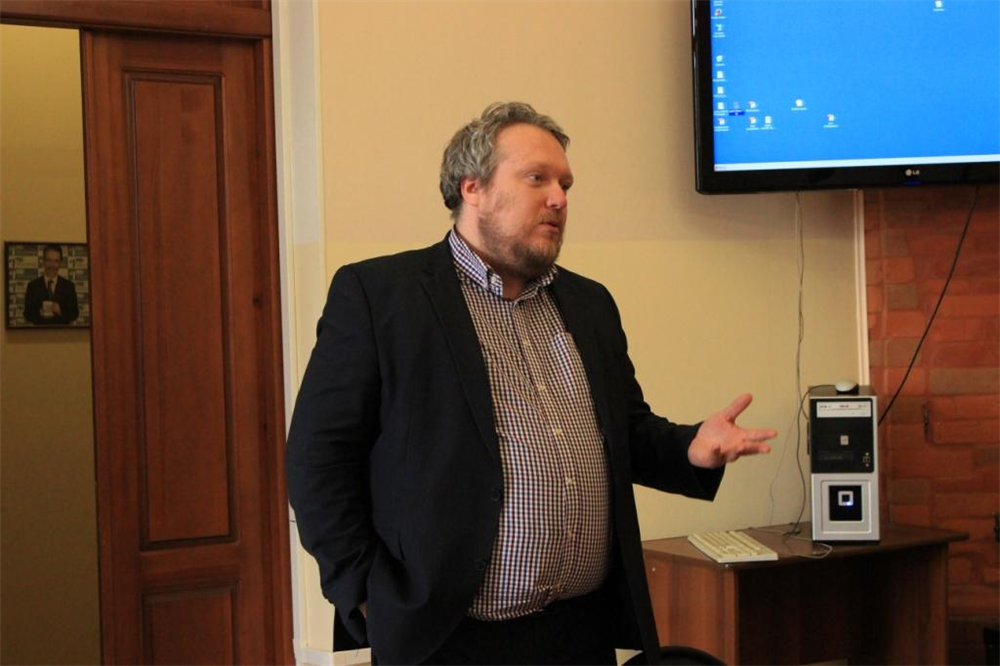
Декан Высшей Школы Журналистики Мясников Илья Юрьевич провел открытую лекцию в рамках проекта «Развитие иноязычной компетенции ТГУ».
На лекции, Илья Юрьевич рассказал студентам о самых современных технологиях и трендах в инфографике и современном дизайне, познакомил с ведущими специалистами в этой области, продемонстрировал их работы, а также поделился итогами поездки в Гонконг на Саммит Инфографики, участниками которого были сотрудники известных изданий и порталов, в том числе агентства Reuters, изданий National Geographic, Wall Street Journal, Financial Times, South China Morning Post. Студенты также услышали о совместном проекте с известными мировыми дизайнерами и журналистами из Азии, Европы и Америки, которые приняли участие в практических мастерских по созданию визуальных историй.
Илья Юрьевич ответил на вопросы студентов, обратив внимание на то, что визуализация данных и инфографика - это обширное поле деятельности, которое дает возможность создавать что-то новое, развиваться, экспериментировать, изучать новые технологии и возможности дизайна.
An open lecture on data visualization and infographics was held at Higher School of Journalism.
The Dean of Higher School of Journalism, Myasnikov Ilya Yurievich, held an open lecture in the framework of the project "
Foreign Language Competence Development of TSU Students ".
At the lecture, Ilya Yurievich told the students about the latest technologies and trends in infographics and modern design, acquainted with leading experts in this field and demonstrated their work, and also shared the results of his trip to the Hong Kong Infographics Summit, of which participants were employees of well-known publishing houses and portals, including Reuters, National Geographic, Wall Street Journal, Financial Times and the South China Morning Post.
The students were also told about a joint project with famous world designers and journalists from Asia, Europe and America, who took part in workshops and created visual stories.
Ilya Yurievich answered students' questions, drawing attention to the fact that visualization of data and infographics is a vast field of activity that makes it possible to create and develop something new, to experiment, to study new technologies and design possibilities.